Example Variables(Open Data):
The Fennema-Sherman Mathematics Attitude Scales (FSMAS) are among the most popular instruments used in studies of
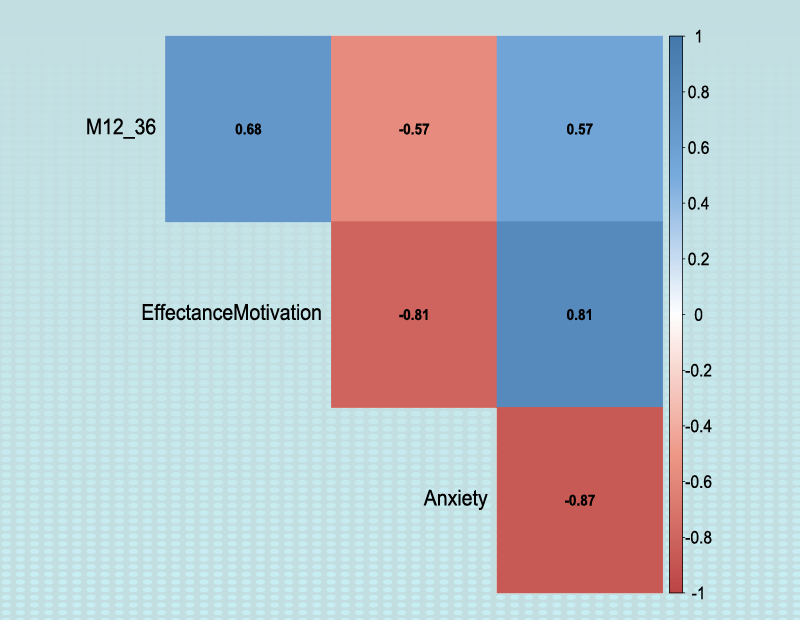
attitudes toward mathematics. FSMAS contains 36 items. Also, scales of FSMAS have Confidence, Effectance Motivation,
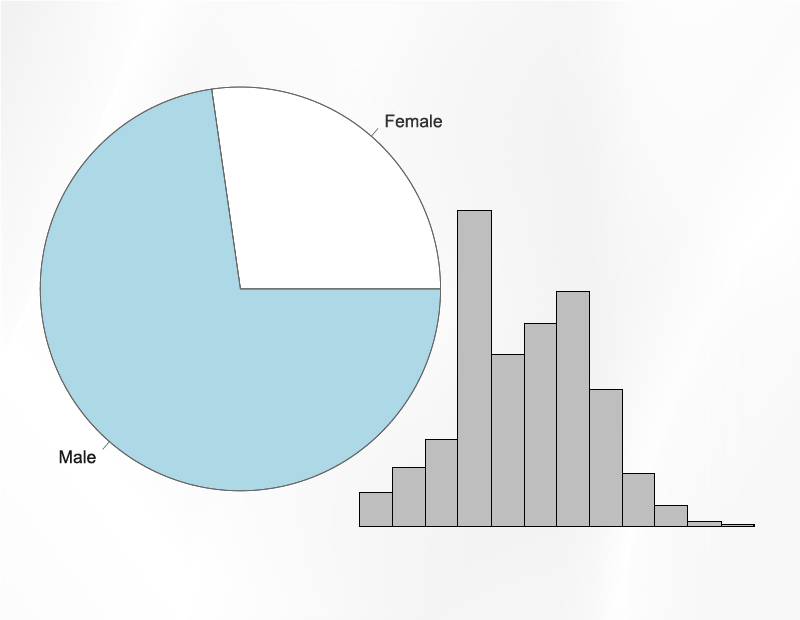
and Anxiety. The sample includes 425 teachers who answered all 36 items. In addition, other characteristics of teachers,
such as their age, are included in the data.
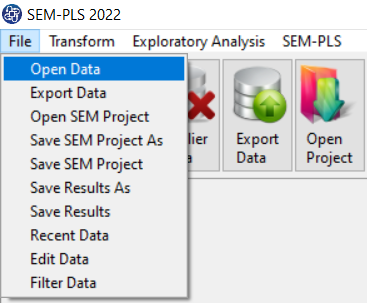
You can select your data as follows:
1-File
2-Open data
(See Open Data)
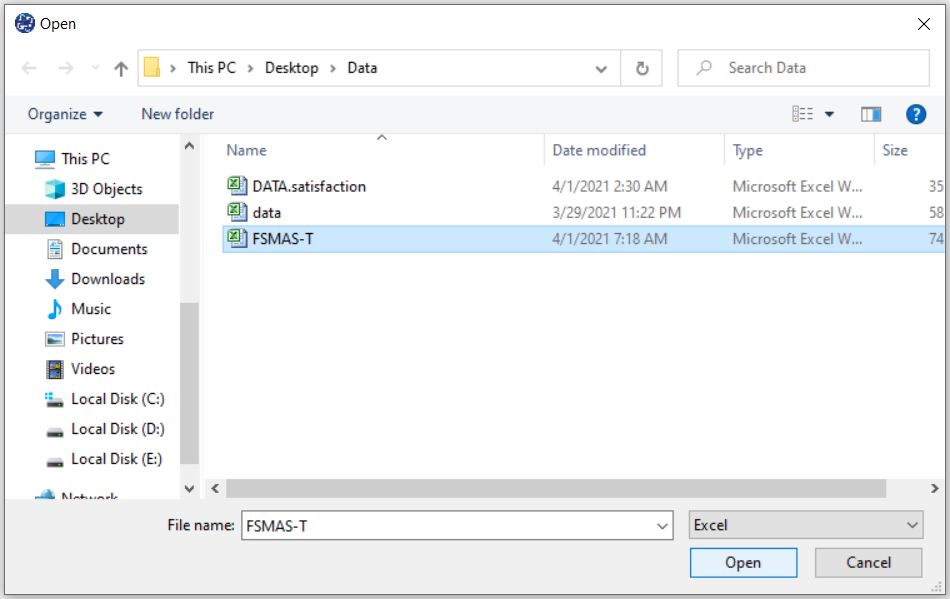
The data is stored under the name FSMAS-T(You can download this data from
here ).
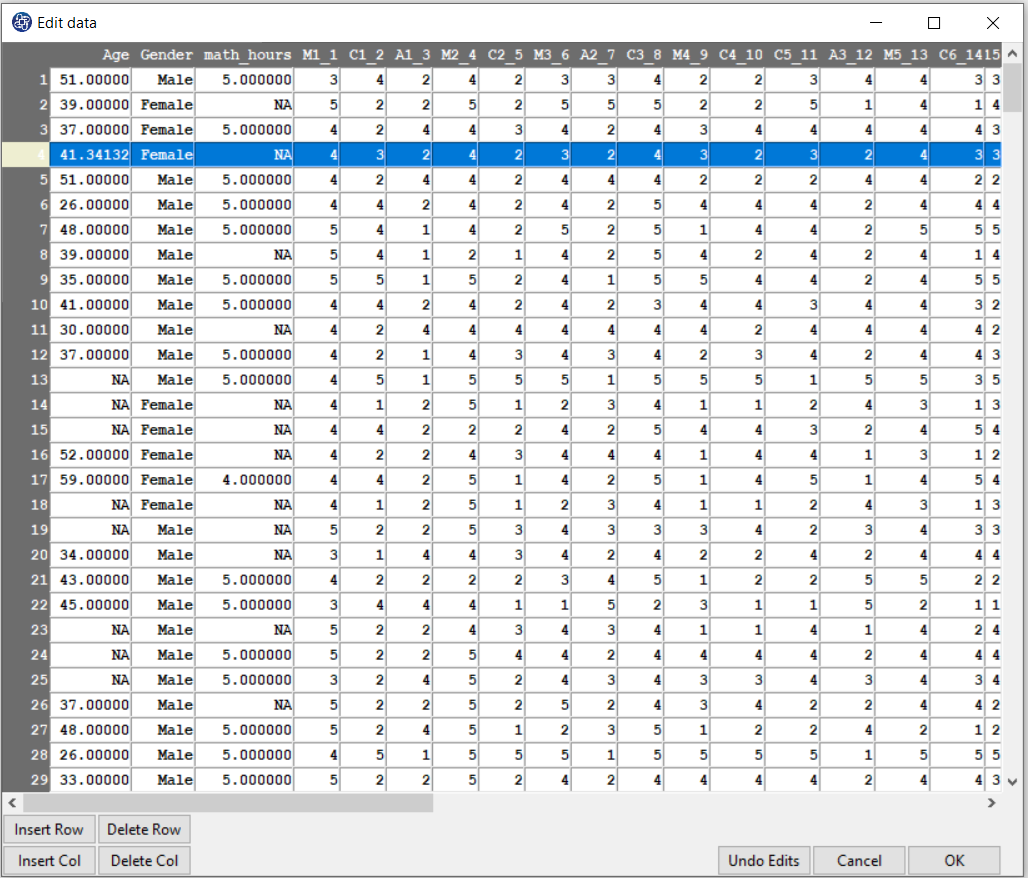
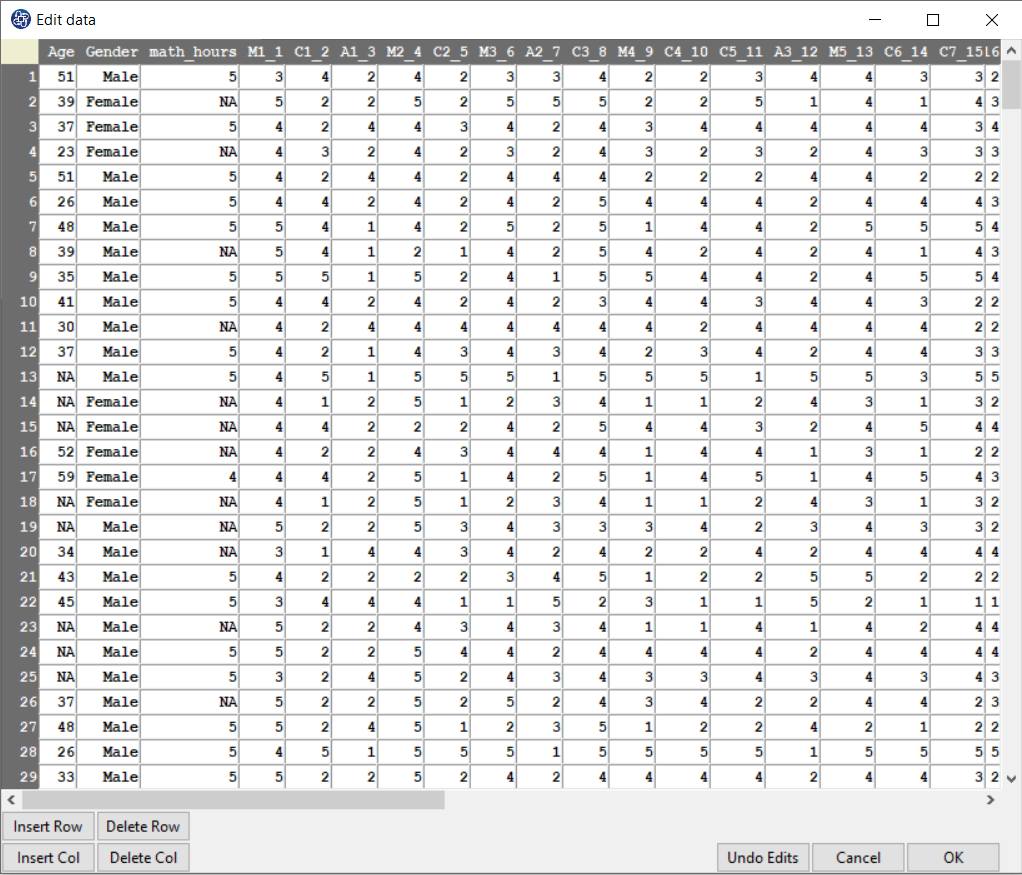
You can edit the imported data via the following path:
1-File
2-Edit Data
(See Edit Data)
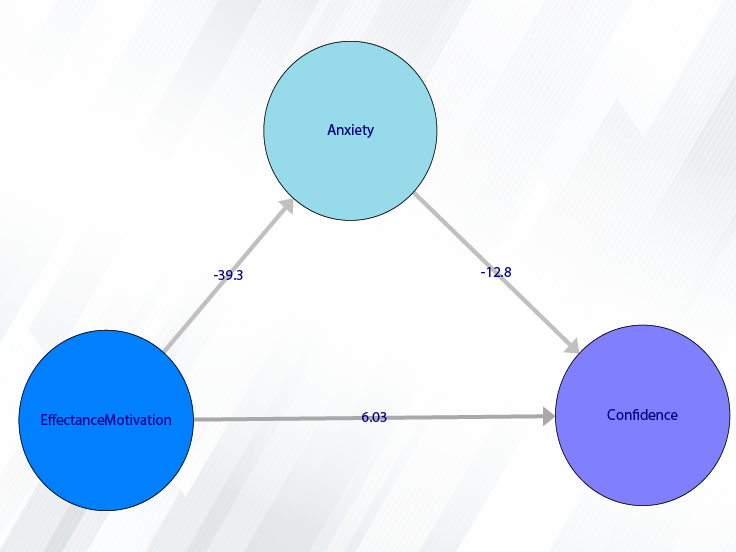
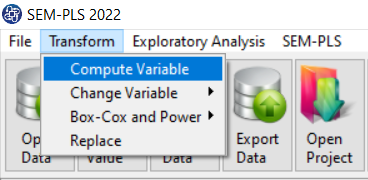
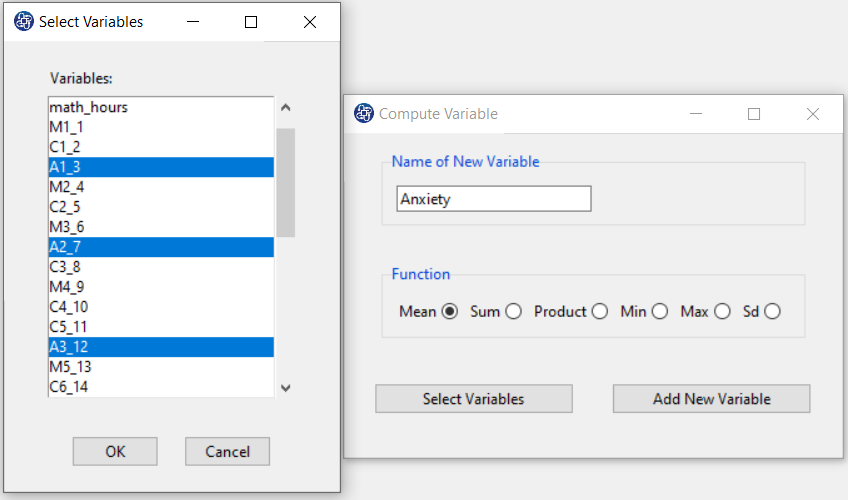
Example Variables(Compute Variable):
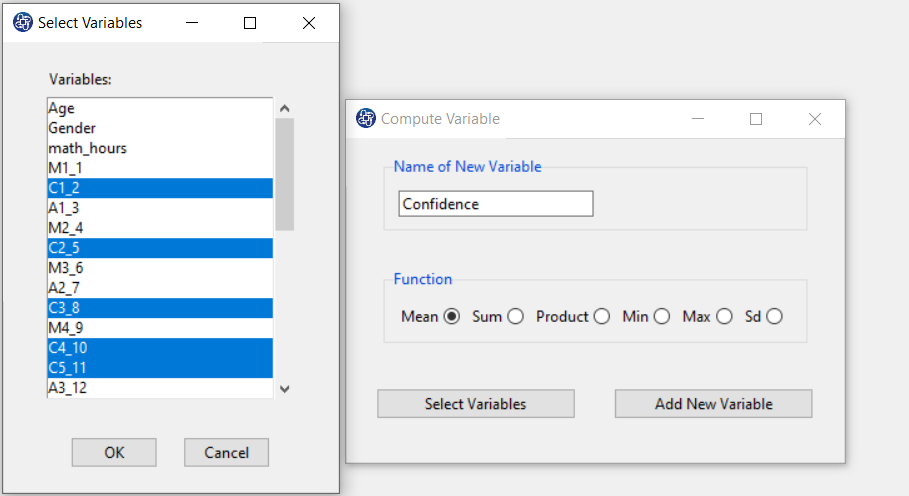
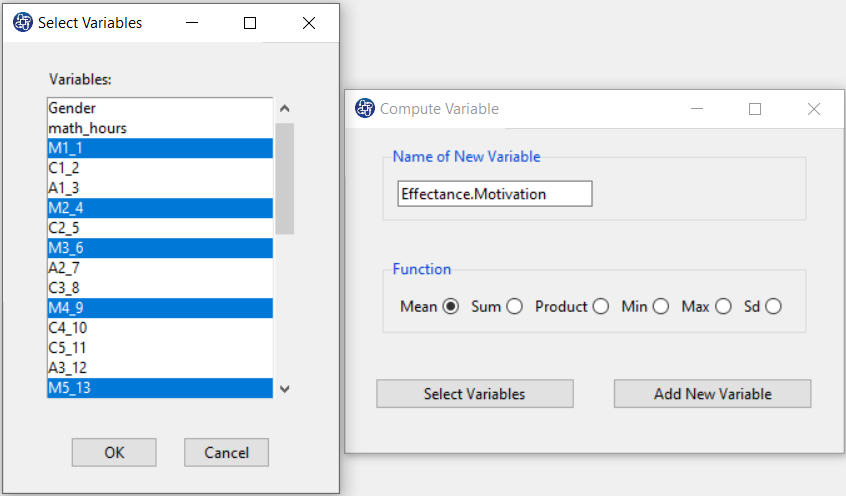
The three variables of Confidence, Effectance Motivation, and Anxiety can be calculated through the following path:
1-Transform
2-Compute Variable
Items starting with the letters C, M, and A are related to the variables Confidence, Effectance Motivation, and Anxiety, respectively.
(See Compute Variable)
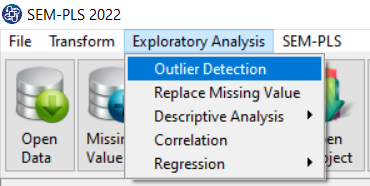
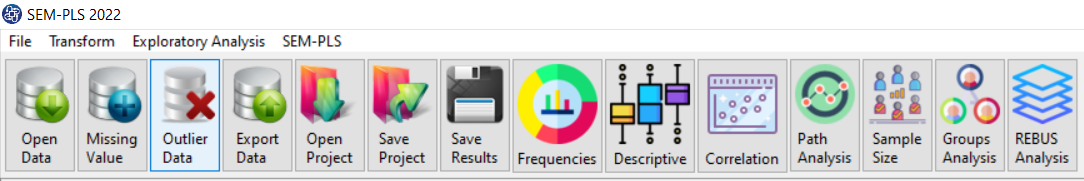
Path of Outlier Detection:
You can detect outliers data via the following path or Outlier Data button:
1-Exploratory Analysis
2-Outlier Detection
A. Outlier Detection:
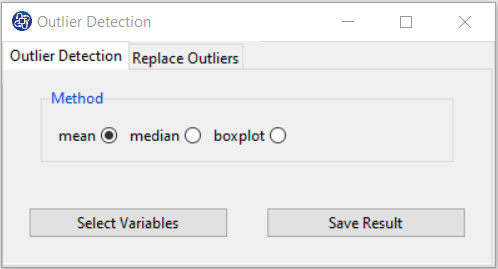
Outlier Detection window includes two tabs, Outlier Detection and Replace Outliers.
Method panel is located in the Outlier Detection tab. This panel includes the following options:
*mean:
In this method, x is considered as outlier data if established in the following relation:
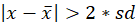
 : mean of data
sd: standard of deviation of data
*median:
In this method, x is considered as outlier data if established in the following relation:
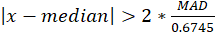
 : median of data

*boxplot:
In this method, x is considered as outlier data if established in the following relation:

 (25th percentile)
 (75th percentile)
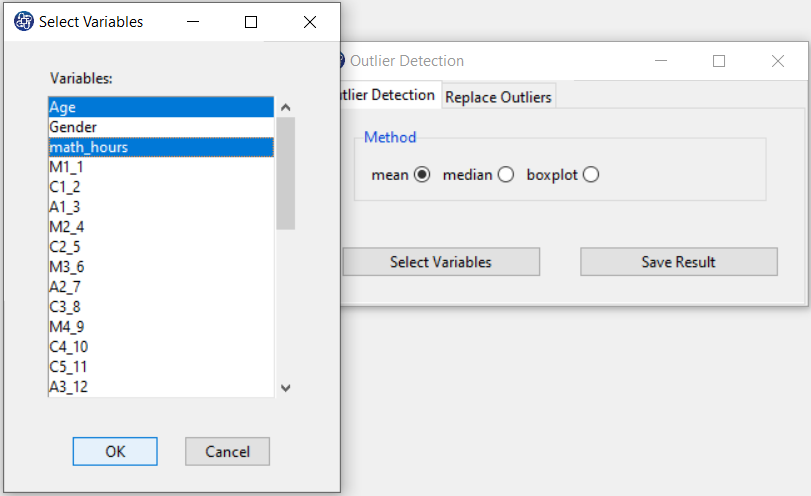
B. Select Variables:
In the first step, you must select the variables that you want through the Select Variables window.
For example, the two variables Age and math_hours are selected in this data.
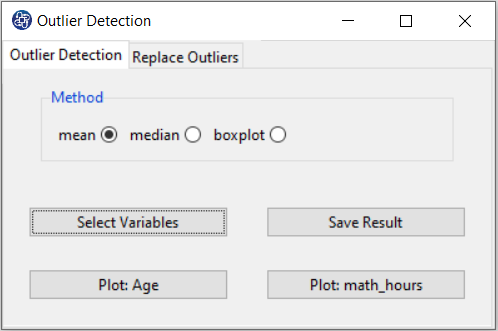
C. Plot:
After selecting the variables, a button will appear for each selected variable.
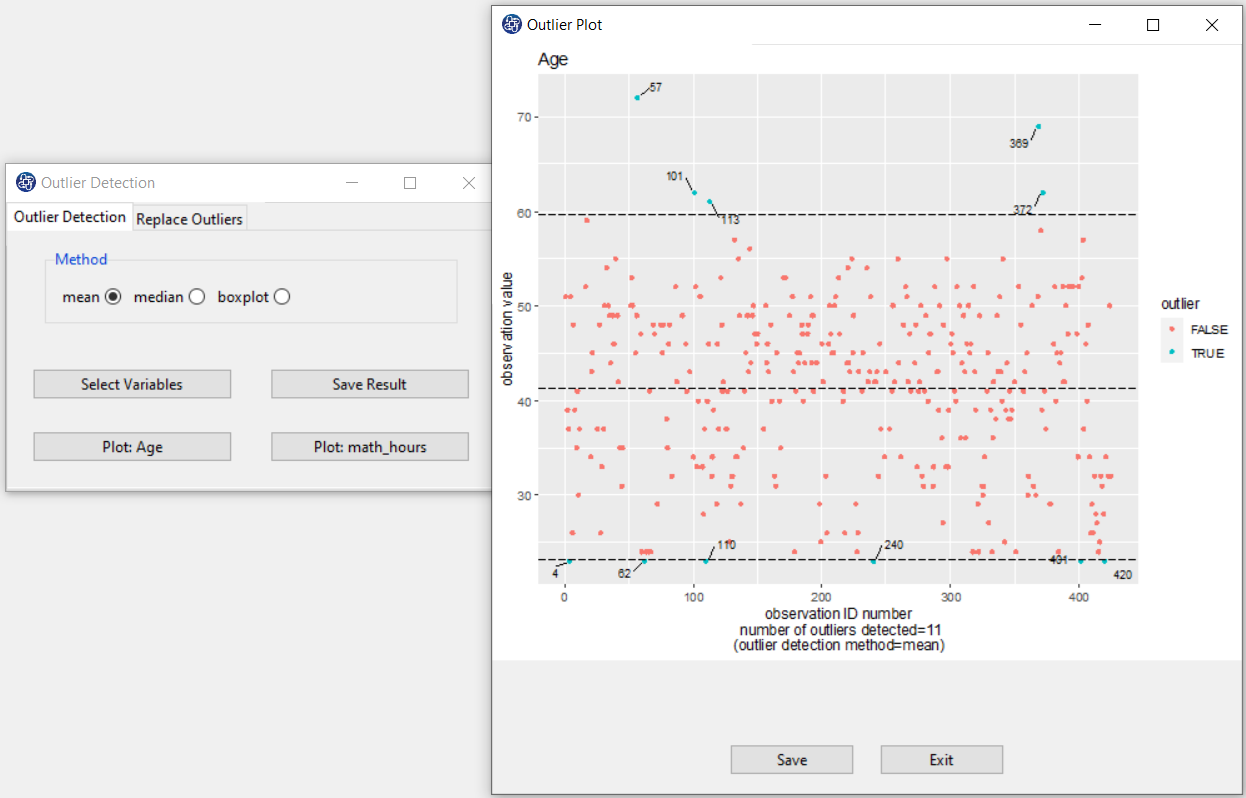
D. Save Plot:
By clicking on the plot button, the scatter plot will appear based on the Method panel.
In this plot, the boundaries of outlier data detection are drawn according to the type of method.
If the data is outside these limits, it is recognized as outlier and its row number is specified in the plot.
You can save the plot by clicking the Save button in one of the following formats:
-JPEG
-PNG
-PDF
-Postscript
-BMP
-SVG
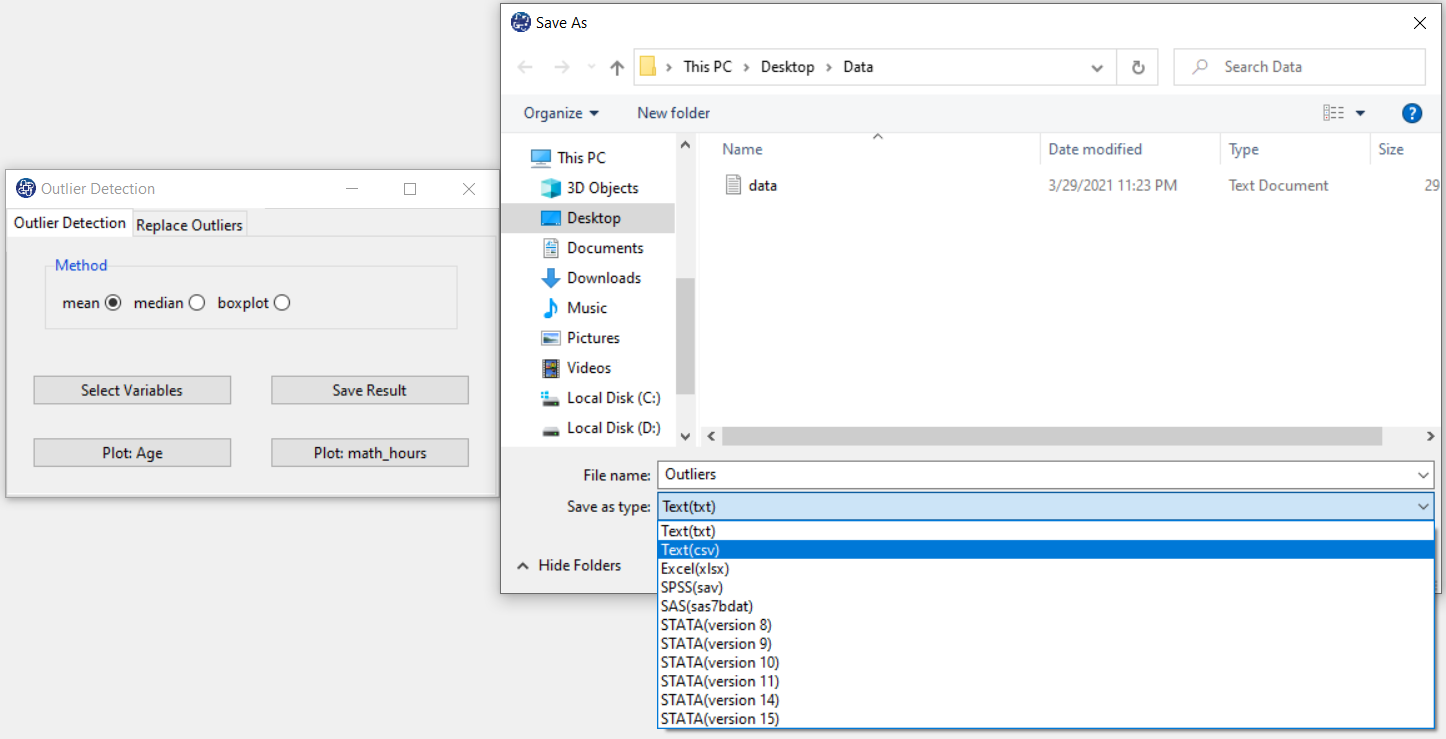
E. Save Result:
You can export results of outlier detection in one of the following formats by selecting the desired path:
-Text ( .txt and .csv)
-Excel (.xlsx)
-SPSS ( .sav )
-SAS ( .sas7bdat)
-STATA (.dta)
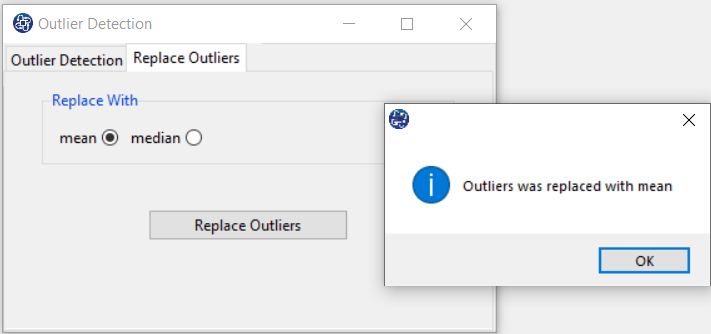
F1. Replace With:
You can replace the outlier data with one of the mean or median indices.
F2. Replace outliers:
This button replaces the outlier data with one of the mean or median indices. This message will appear if outliers are replaced successfully:
<< Outliers was replaced with Replace With >>
For example, << Outliers was replaced with mean >>
G. Check Edit Data:
In the Edit data window, you can see the changes made. For example, the third row of the Age variable is replaced by the mean of this variable.