Path of Groups Analysis:
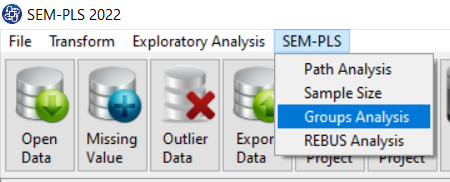
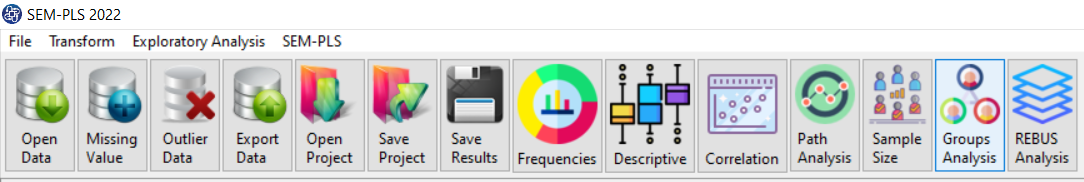
You can perform Groups Analysis by the following path or the Groups Analysis button :
1-SEM-PLS
2- Groups Analysis
A. Groups Analysis:
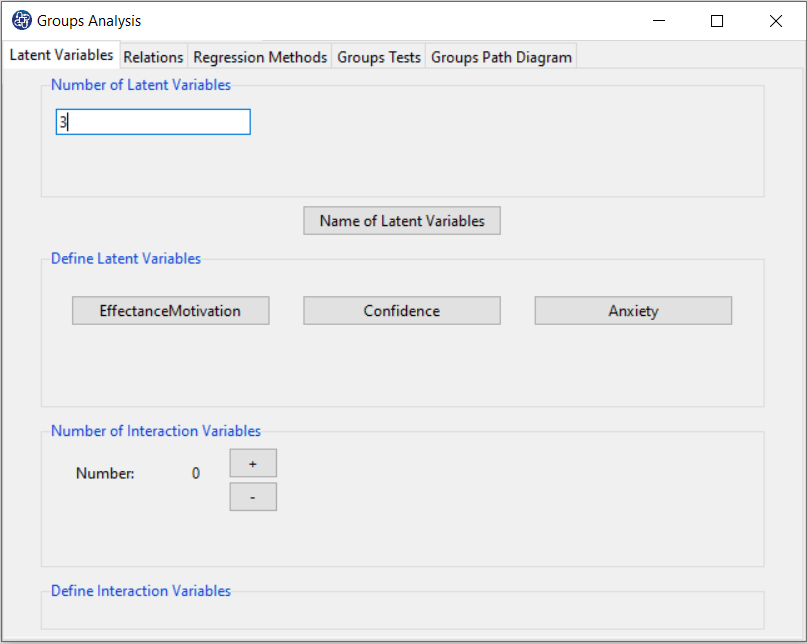
Groups Analysis window includes five tabs: Latent Variables, Relations, Regression Methods, Groups Tests, and Groups Path Diagram.
The first three tabs are similar to Path Analysis. The user may use the software only for Groups Analysis.
For this purpose, three tabs in Path Analysis are listed in this window. Therefore, to Groups Analysis, there is no need to
use the Path Analysis window.
Note that any changes in this window will apply to the SEM-PLS Model in other windows and conversely.
(See Path Analysis)
B. Groups Tests
B1. Method:
In this panel, you can select the groups tests in the following two methods:
1-t test
2-Permutation test
(See Introduction to SEM-PLS: E.4.2.2. Group Analysis)
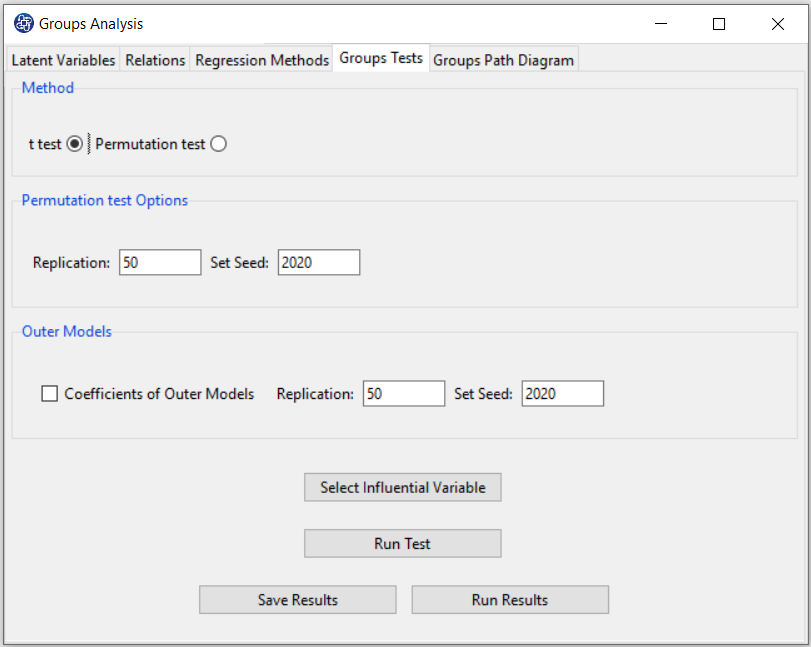
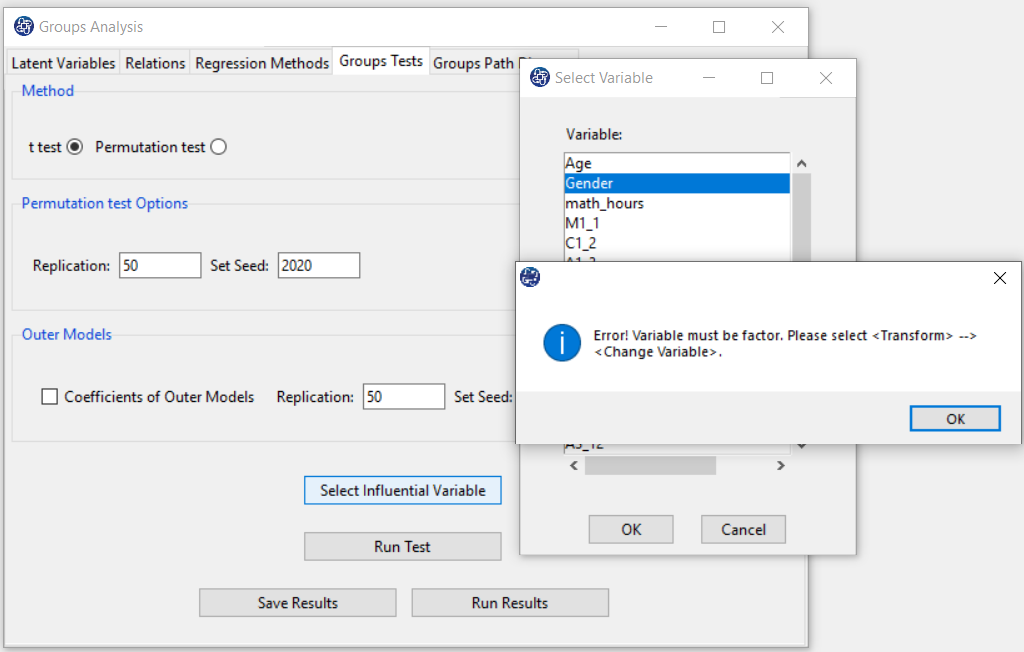
B2. Select Influential Variable:
For Groups Tests, you must select the variable you guess will cause the difference in the results.
This variable must be factor. You may occurrence this error by selecting influential variable:
“Error! Influential Variable must be factor. Please select < Transform> --> < Change Variable>.”
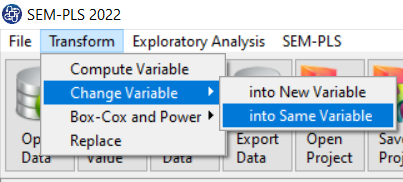
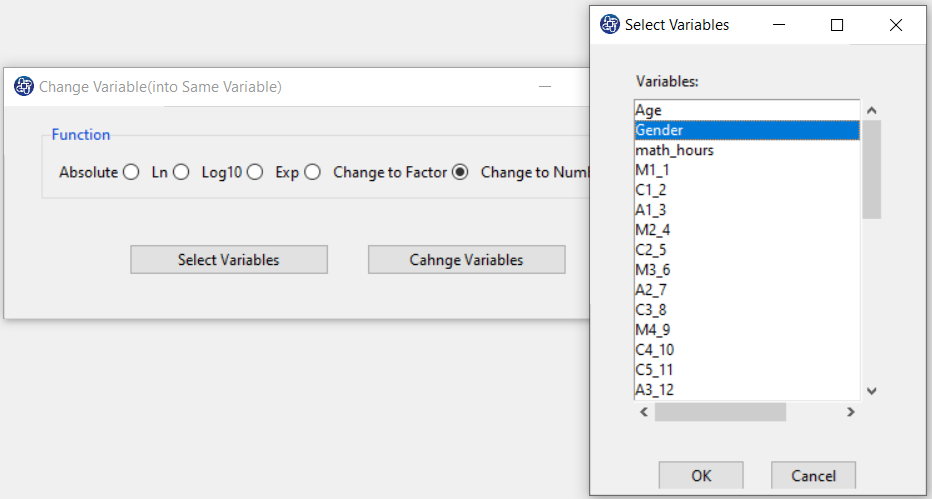
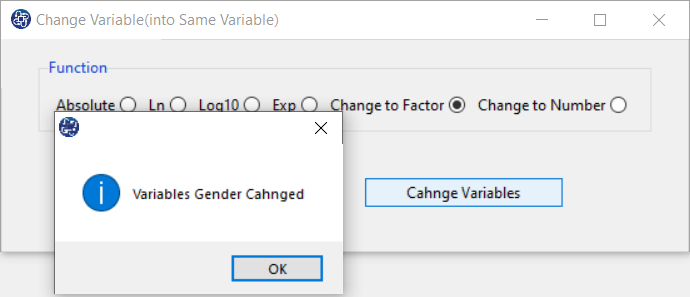
To solve this problem, you must change the variable type from the following path:
1-Transform
2- Change Variable
3-into Same Variable or into New Variable (See
Change Variable)
Similarly, this button is repeated in the Groups Path Diagram tab.
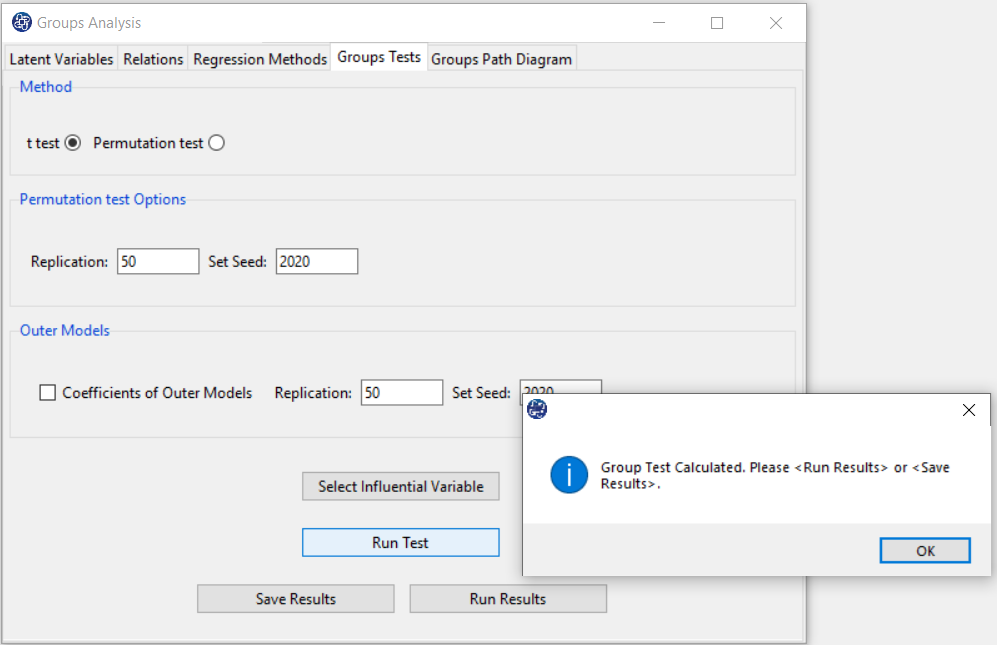
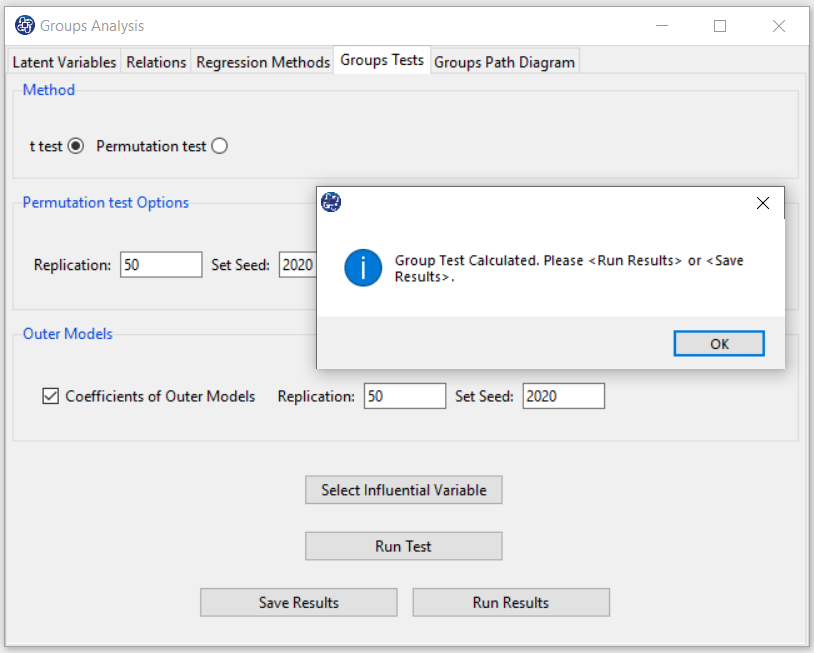
B3. Run Test:
By clicking this button, you can Group Test.
This variable must be factor. You may occurrence this error by selecting influential variable:
If this test is done without problems, this message appears:
“Group Test Calculated. Please < Run Results> or < Save Results>.“
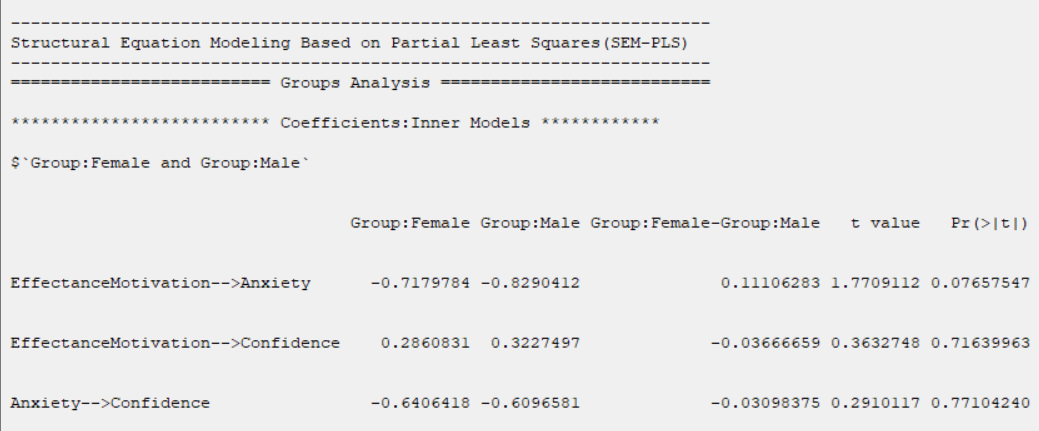
B4. Run Results (t test):
After clicking on the Run Results button, for each pair of influential variable categories,
you can see the results of selected test in the main software window.
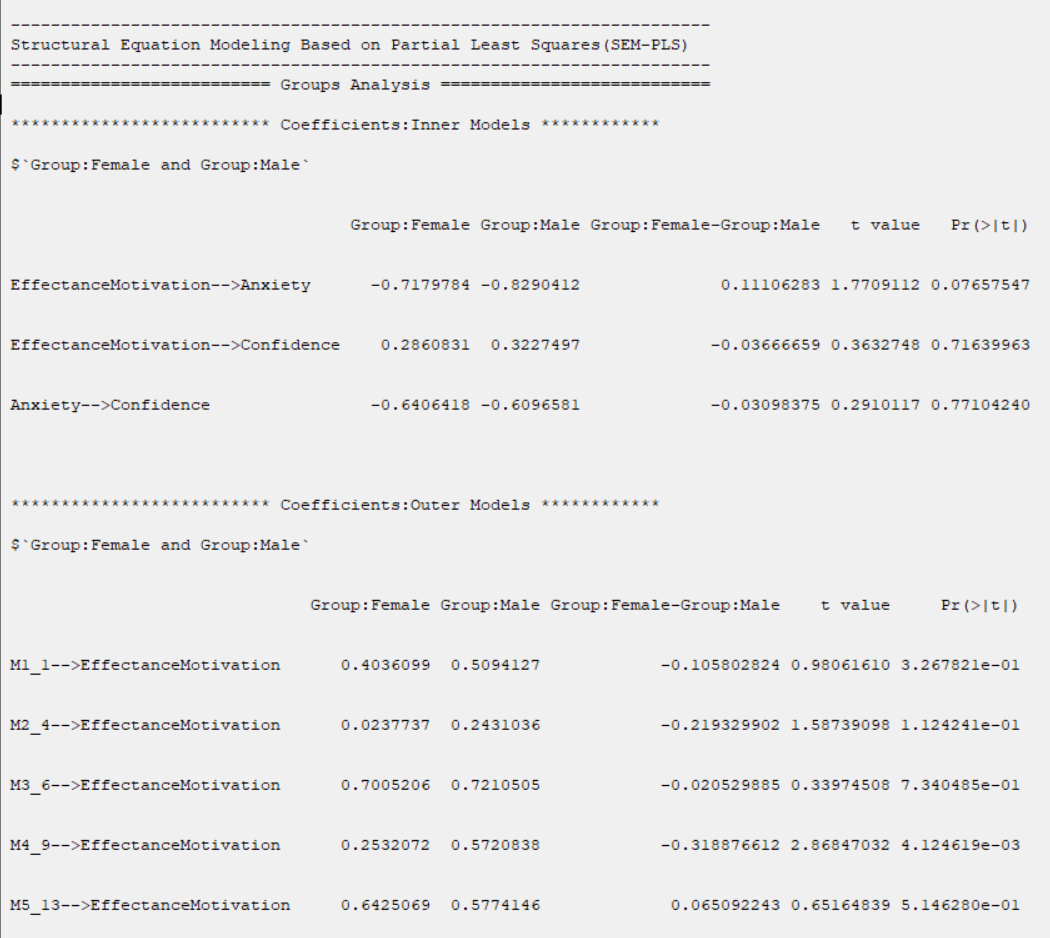
This table compares the inner models coefficients for each of the relationships.
In this table, the following indices are provided:
The coefficient of each relationship in each group
*The coefficient difference between the two groups
*t value (See
Introduction to SEM-PLS: E.4.2.2.1. t test
)
*P-Value as shown in the table with Pr(>|t|). (See
Introduction to SEM-PLS: E.4.2.2.1. t test
)
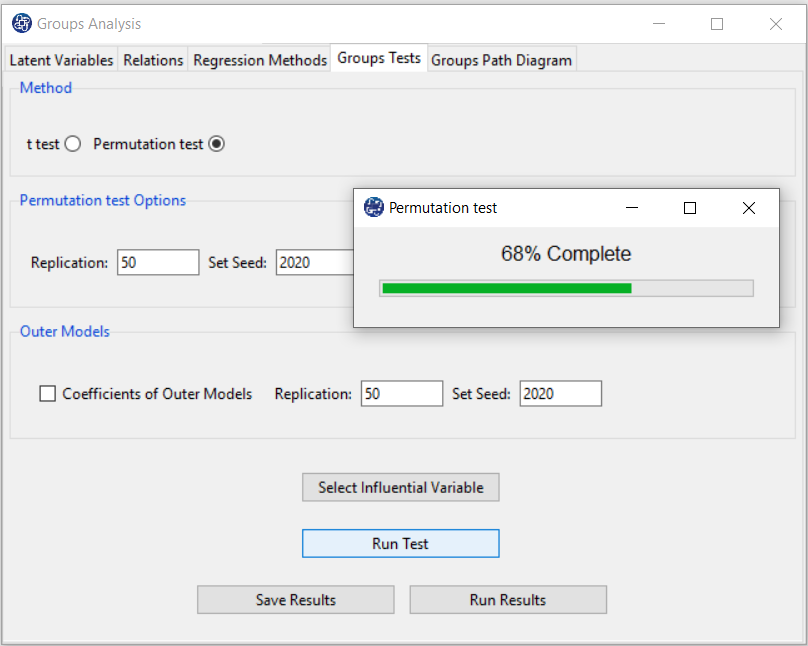
B5. Run Results (Permutation test):
Due to the structure of the Permutation test, this test requires more time than other tests.
The percentage of progress of this test will be determined.
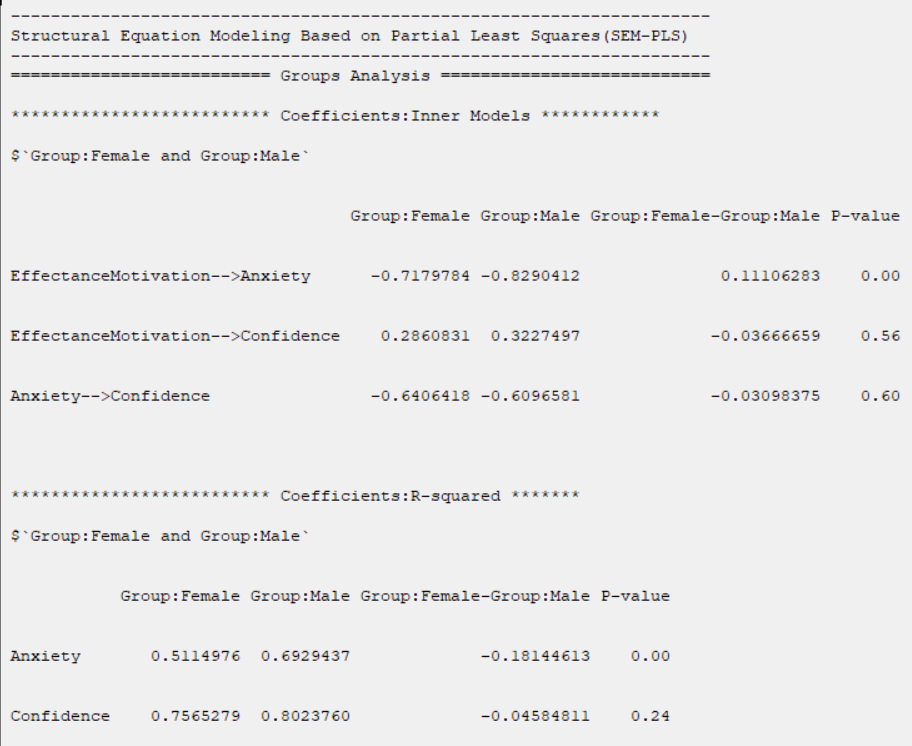
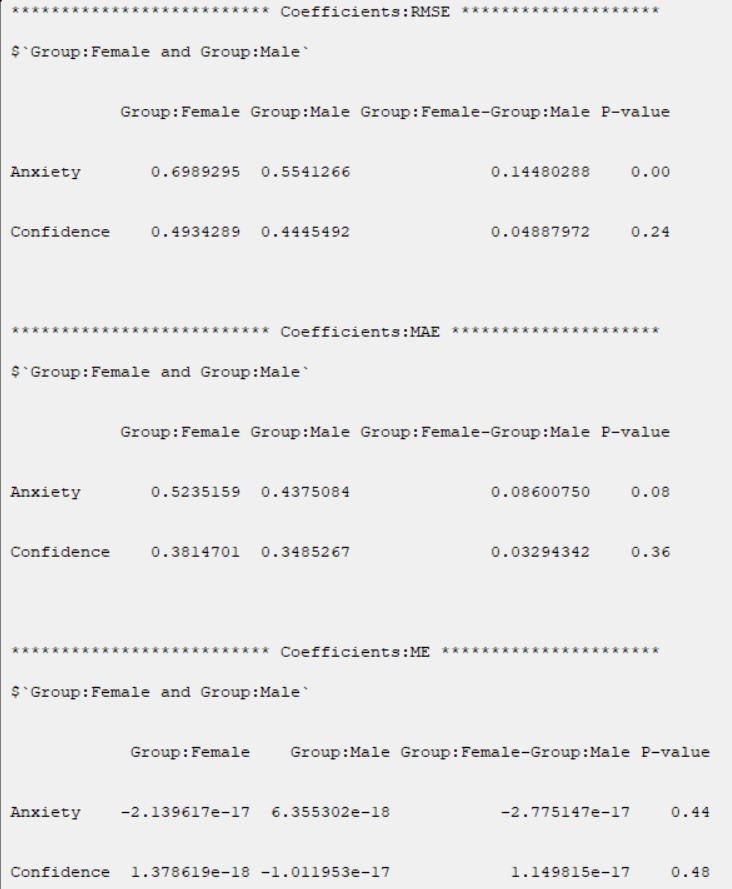
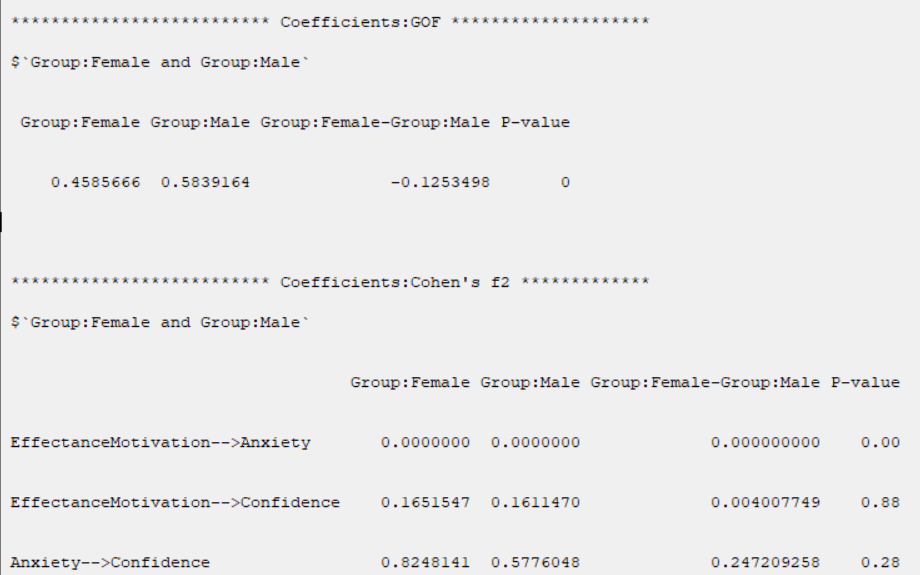
t test can not test the difference between groups in R2 , GOF, Cohen's f2
, ME, MSE, RMSE and MAE indices. To solve this problem, permutation test can be suggested.
In R-squared(R2), RMSE, MAE, ME, these indices are separated by the name of the dependent variable.
B5.1. Permutation test Options:
The permutation test is performed with the following features:
*Replication: Number of Replication(B in equations).
*Set Seed: It is an arbitrary number that will keep the results fixed by holding it fixed.
(See
Introduction to SEM-PLS: E.4.2.2.2. Permutation test
)
B6. Outer Models (Coefficients of Outer Models):
If you enable this option, you can compare measurement variables in different groups.
After activating this option, a table with the following title will appear in the results:
“*********Coefficients:Outer Models*****”
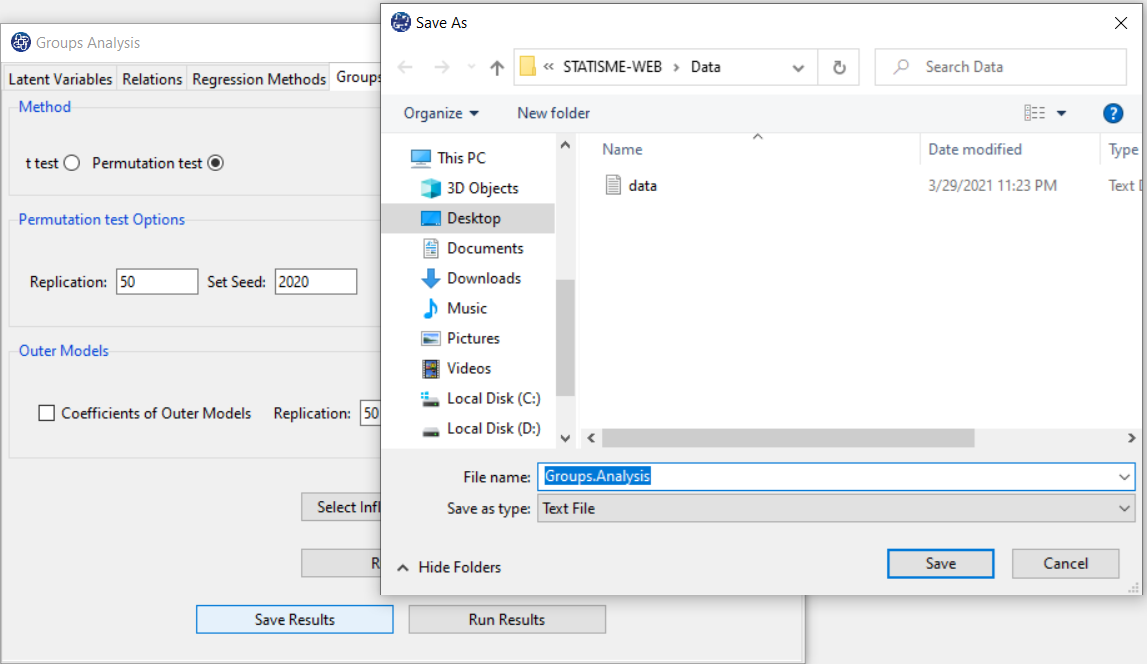
B7. Save Results:
By clicking this button, you can save the Groups Analysis results. After opening the save results window, you can save the results in “text” or “Microsoft Word” format.
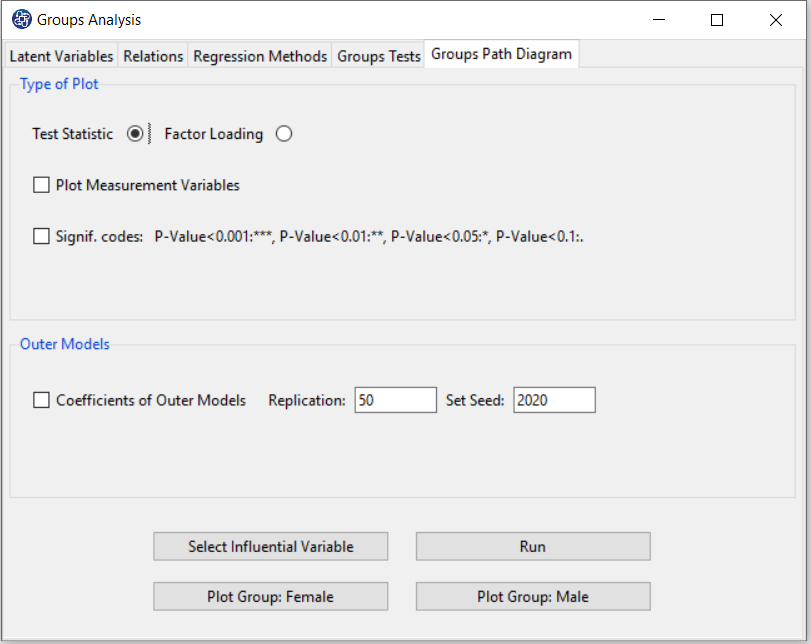
C. Groups Path Diagram
C1. Path Diagram:
This window contains the following two panels:
C1.1.Type of Plot:
In terms of path coefficient, there are two types of path diagrams:1-Test Statistic: If this option is enabled, the coefficients in the path diagram will be the value of the statistic t or F (depending on the regression method). With these coefficients, you can decide whether the relationship between the variables is significant.
2-Factor Loading: If this option is enabled, loadings in the outer model and the coefficients of the regression in the inner model will appear.
*Plot Measurement Variables:If this option is disabled, only inner models will be the plot. But if this option is enabled, the outer model will be the plot.
Note: If this option is enabled and we want to plot the path diagram based on the Test Statistic, the results must be executed (RUN) by activating the Outer Models option.
*Signif. code: By activating this option, the path coefficients(Factor Loading or Test Statistic) will be displayed with a significant sign.
C1.2. Outer Models:
*Coefficients of Outer Models: If you enable this option, you can compare measurement variables in different clusters.To calculate t value of measurement variables, the software uses the bootstrap method. Bootstrap is performed with the following features:
*Replication: Number of Replication(B in equations)
*Set Seed: It is an arbitrary number that will keep the results fixed by holding it fixed.
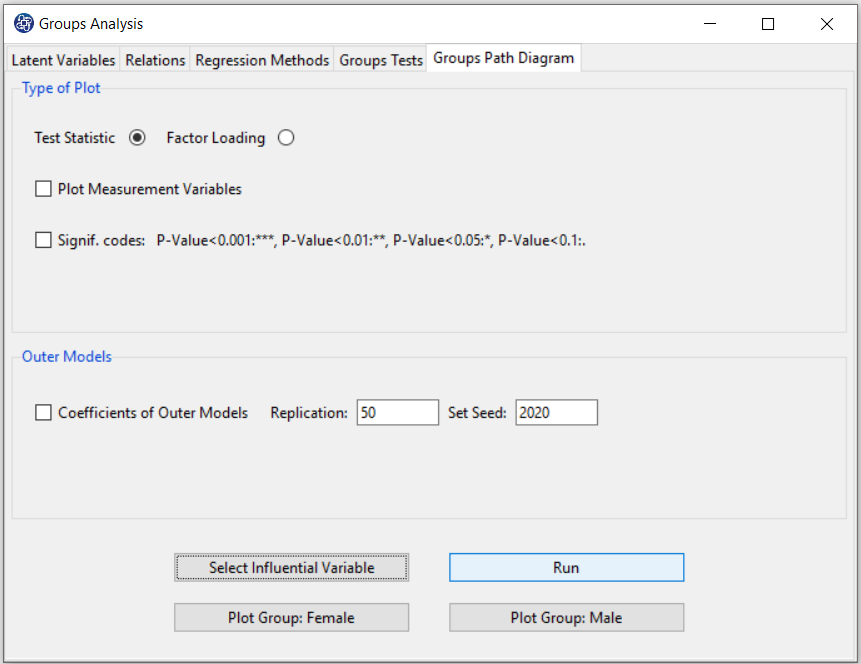
C2. Run:
By clicking on this button, you can estimate the model coefficients by categories of the influential variable.
Note: If you have performed Run Test in the Groups Tests tab, you do not need to run this button to plot a path diagram.
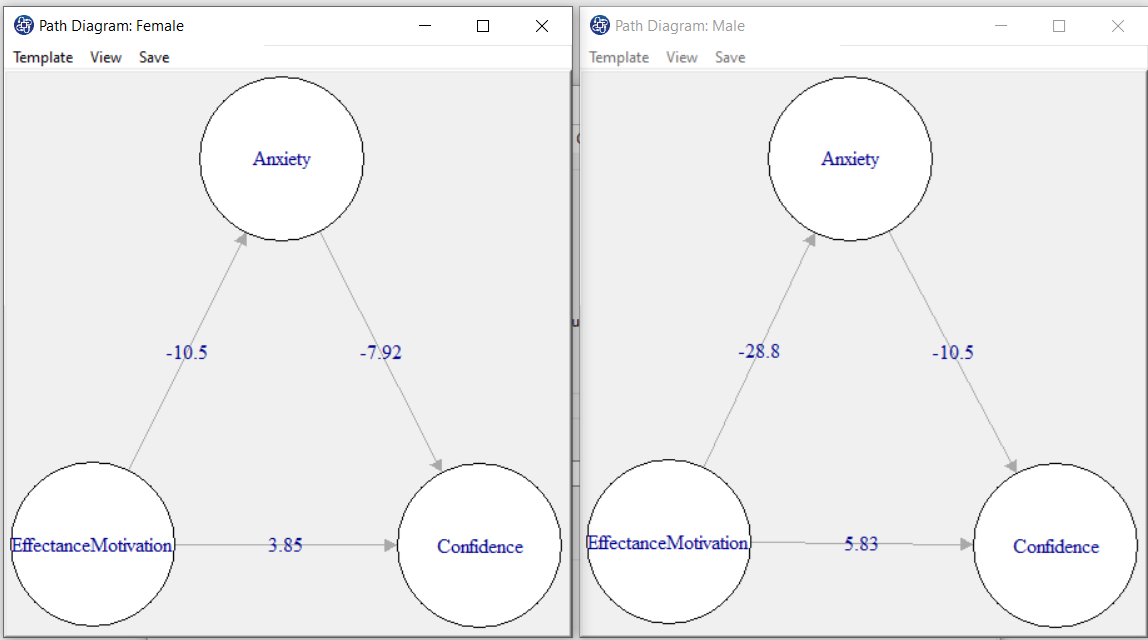
C3. Plot Group:
After selecting the influential variable, for each category of this variable, a button for the path diagram will appear. You can examine the effect of this variable by plotting these path diagrams.